Chicken Road 2
Outcome generator: independently unverified by us.
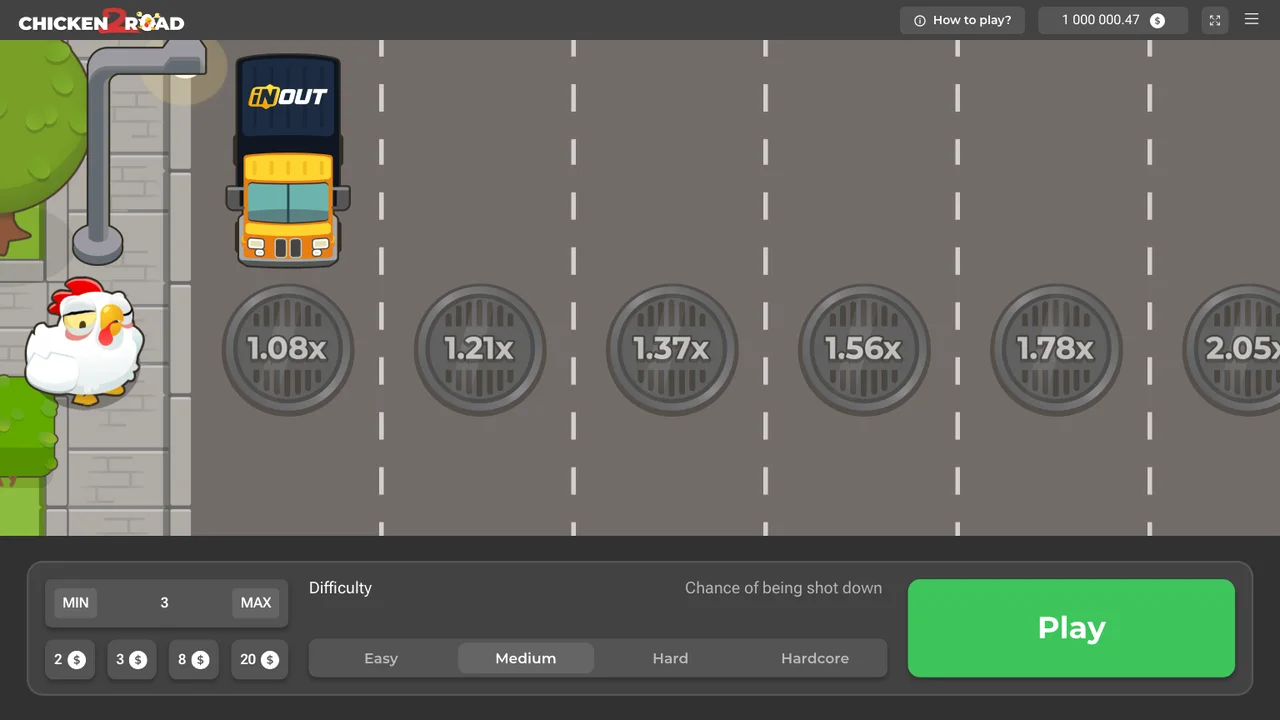
Bet Chicken Road review 2 / 2 · InOut Games · 2025
Explore Chicken Road 2, its four longer ladders, published 95.5% RTP and free demo. Separate the game’s rules from a casino’s payment conditions. 18+.
Bet Chicken Road research team · Read our recording method
Demo credits have no cash value. Adults 18+.
Long-run return figure: 95.5% · Maximum game payment: 20,000 USD
Read this version’s full reviewChicken Road 2 is InOut Games' sequel to the move-or-collect gambling game. This Chicken Road 2 review keeps the new road lengths and USD limits separate from the first title. You choose a stake and difficulty, request a move and decide whether to collect after a success. Another move can lose the round, however familiar the screen may look. InOut released it on 15 April 2025.
The sequel allows 0.12–200 USD on a round and has a 20,000 USD maximum game win. Its Easy, Medium, Hard and Daredevil roads contain 30, 25, 22 and 18 steps respectively. InOut states 95.5% RTP, implying a 4.5% long-run house edge. The lower percentage matters when larger coefficients or caps suggest better returns.
Also called Chicken Road 2.0, the sequel has its own rules and browser preview. Check the full title and InOut provider label before using its figures, because the first game’s ladder does not describe this version.
The sequel's Easy opening sequence is ×1.01, ×1.03 and ×1.06. The first successful move therefore adds only a small fraction of the initial stake to a possible collect amount. The endpoint is ×23.24, reached only if the round survives the earlier moves. Looking at that last tile does not say how often it will become available.
Read the whole amount on the collect button as gross return. It includes the money put into the round. A small increase above the stake can look more substantial if it is described only as a multiplier or a payment. Before another move, identify exactly which reached amount you are putting back at risk. That is a clearer decision than treating a long Easy road as a promise of many successful moves.
Medium begins at ×1.08, followed by ×1.21 and ×1.37, and reaches ×2,457 at its endpoint. Its 25 steps create more listed positions than the first game's Medium road. More positions tell you how the ladder is arranged; they do not tell you that any individual player's round will last longer.
At a fixed stake, compare the reached coefficient with the next requested move. The amount currently available to collect is being exchanged for a chance at a different amount. If a demo run ends early, it has shown a possible outcome, not that Medium is about to improve. Keep earlier round results out of the decision about what the next random outcome is supposed to do. The ladder gives payment values, not a timetable for success.
Hard contains 22 steps in Chicken Road 2. The first coefficients are ×1.18, ×1.46 and ×1.83, while the final one is ×62,162.09. Opening the first game with the same difficulty name gives a different ladder, so confirm the title before comparing an amount or a position.
The 20,000 USD maximum game win still limits the result of a stake-and-multiplier calculation. Read how the game's rules apply that ceiling, and keep any casino withdrawal conditions separate. Fewer steps than Easy do not bypass uncertainty. The setting changes the betting path, while a failed move can still cost the full round stake.
Daredevil has 18 steps and opens at ×1.44. The next values are ×2.21 and ×3.45, and its final coefficient is ×3,608,855.25. The large gap between beginning and end makes the last tile visually striking. It does not say that the endpoint is a practical target or a likely destination for a session.
Treat an attempt to reach a distant tile as a series of choices to expose a reached amount again. The current collect amount is concrete when available; the later coefficient remains conditional. A staking plan that assumes the endpoint will rescue previous losses ignores both the possibility of failure along the road and the game-win cap. You do not need to attempt the largest ladder to understand its numerical limits.
The sequel's permitted stake range is 0.12–200 USD. Neither end describes a casino deposit requirement. A cashier can use another currency and have its own limits, fees or verification steps. Read the actual amount entering the round rather than translating the maximum bet into a personal spending goal.
Choose a possible loss you could accept before starting the game. A smaller bet changes the amount attached to the result without giving you more information about whether a move succeeds. After a failed round, keeping the next stake steady or ending play respects the earlier spending decision. Doubling an amount to recover money exposes more of the remaining budget to the next random event. The sequel's higher maximum is a permission in the game, not a reason to use it.
InOut lists 95.5% RTP for Chicken Road 2: a 4.5% long-run house edge. The step counts and coefficients do not reveal the long-run return on their own. A large payout can be associated with a small chance of reaching it; a small opening multiplier can also carry uncertainty. Without the required outcome probabilities, the displayed payments are not enough to calculate an expected return.
Keep this distinction when reading a comparison table. Known fields include the stake range, maximum game win, route lengths and visible coefficients. A short demo run can be described as what happened during those rounds, but its return is not a substitute for the theoretical percentage. Keeping both returns visible is more accurate than transferring the earlier title’s percentage to the sequel.
The collect control ends a successful round at its available value. Read the amount it offers now, rather than treating the next tile as if it were already yours. Continuing gives up that settlement opportunity in exchange for another uncertain move. A preferred cash-out point can organise your behaviour but does not reveal the result of that move.
Net profit on a winning round is gross payment minus the initial stake. A casino balance change across a whole session also includes every other round and any applicable account costs. Do not judge the session solely by its largest collect. Several visible wins can be followed by losses that leave less than the starting balance. Keep the complete spending ceiling in view when the interface encourages attention to a single large number.
Before starting, check that the game title says Chicken Road 2 and read the selected difficulty. Then find the stake field and the current collect amount. A familiar chicken and road can make it easy to skip these checks, especially when you move between versions or reopen a browser tab. Read the settings again after such a switch.
A phone screen needs to display the active controls clearly. If you cannot see the amount and action together, adjust the view before staking. There is no standalone InOut Chicken Road app to install for this exercise. Use the intended browser service, and distinguish its game from third-party products with similar names. On Android or iPhone, the browser needs no App Store installation to open the demo.
A demo balance consists of practice credits, with no right to withdraw it as cash. That makes the demo useful for seeing what the controls do. Try a reached cash-out, read how the finished round appears and then compare another difficulty with the same stake selected. You are learning the screen rather than testing a way to make dependable money.
Changing both stake and difficulty at once makes the resulting payment harder to interpret. Keep one unchanged so you can see which change caused the displayed amount to scale. A lucky run under one setting cannot prove that setting is better for your next session. Practice wins do not verify the sequel’s 95.5% theoretical return, however persuasive they feel.
The data blocks identify the game and difficulty behind their totals. Check both before comparing a proportion of rounds reaching a step. A ladder length is fixed game information, while a chart total concerns the rounds represented there. Reading them together does not turn past outcomes into a probability check for the next result.
A limited run can contain a large return that shifts its average. Read the distribution, total rounds and dates instead of choosing the tallest bar as a betting signal. An illustrative chart does not report real game testing. Keep its labels attached. We do not turn a short run or a screenshot into independent verification of the sequel's fairness or its long-run return.
The casino controls registration, age and identity checks, deposits and withdrawal requests. InOut supplies the game. Find the operator's name and licence, check the requirements in your location and read its cashier terms before deciding whether to put money into an account. No game review can substitute for those service-specific conditions.
A 20,000 USD game-win cap does not promise a withdrawal of that amount or a particular processing time. Your account currency, bonus restrictions and verification status may also matter to a cashier request. Direct payment questions to the casino through its verified contact route. Bet Chicken Road explains the game but does not hold a balance, approve a payout or change the result of an earlier round.
Trustpilot comments can concern a casino’s service rather than the InOut game itself. Check which company a review names and what transaction it describes. A star rating does not measure the sequel’s return or verify its random outcomes.
Chicken Road 2 changes the numerical comparison: longer roads, different opening values and a higher USD game-win cap. Those are useful facts when you want to understand the sequel rather than apply the original's settings by habit. The original returns more over the long run, 98% against 95.5%, however attractive the sequel’s final coefficients look.
A calm decision begins before selecting a road. Decide whether money belongs at risk, then read the exact stake and possible loss. The game does not owe a return because a previous attempt ended early. A session can end with reading the demo and choosing to leave. Understanding a new ladder gives you information about its amounts, not an obligation to attempt it or a route around random outcomes.
Adults 18+ only. Keep the sequel within affordable spending and time limits. Take breaks from its rounds; never chase losses because its maximum win is higher.
| Reached step | Return multiplier | Proportion under the RTP model | Proportion reaching this point | Gross return relative to the stake |
|---|---|---|---|---|
| 1 | 1.01× | 94.55% | 97.13% | 0.981 |
| 2 | 1.03× | 92.72% | 94.27% | 0.971 |
| 3 | 1.06× | 90.09% | 91.27% | 0.967 |
| 4 | 1.1× | 86.82% | 88.13% | 0.969 |
| 5 | 1.15× | 83.04% | 84.87% | 0.976 |
| 6 | 1.19× | 80.25% | 81.27% | 0.967 |
| 7 | 1.24× | 77.02% | 77.53% | 0.961 |
| 8 | 1.3× | 73.46% | 74.93% | 0.974 |
| 9 | 1.35× | 70.74% | 71.13% | 0.96 |
| 10 | 1.42× | 67.25% | 67.8% | 0.963 |
| 11 | 1.48× | 64.53% | 64.33% | 0.952 |
| 12 | 1.56× | 61.22% | 61.13% | 0.954 |
| 13 | 1.65× | 57.88% | 58.47% | 0.965 |
| 14 | 1.75× | 54.57% | 54.07% | 0.946 |
| 15 | 1.85× | 51.62% | 51% | 0.944 |
| 16 | 1.98× | 48.23% | 47.87% | 0.948 |
| 17 | 2.12× | 45.05% | 44.73% | 0.948 |
| 18 | 2.28× | 41.89% | 41.73% | 0.952 |
| 19 | 2.47× | 38.66% | 38.6% | 0.953 |
| 20 | 2.7× | 35.37% | 35.67% | 0.963 |
| 21 | 2.96× | 32.26% | 32.73% | 0.969 |
| 22 | 3.28× | 29.12% | 29.47% | 0.967 |
| 23 | 3.7× | 25.81% | 26.33% | 0.974 |
| 24 | 4.11× | 23.24% | 23% | 0.945 |
| 25 | 4.64× | 20.58% | 19.4% | 0.9 |
| 26 | 5.39× | 17.72% | 15.8% | 0.852 |
| 27 | 6.5× | 14.69% | 13% | 0.845 |
| 28 | 8.36× | 11.42% | 9.4% | 0.786 |
| 29 | 12.08× | 7.91% | 6.67% | 0.805 |
| 30 | 23.24× | 4.11% | 3.67% | 0.852 |
| Reached step | Return multiplier | Proportion under the RTP model | Proportion reaching this point | Gross return relative to the stake |
|---|---|---|---|---|
| 1 | 1.08× | 88.43% | 89.8% | 0.97 |
| 2 | 1.21× | 78.93% | 79.4% | 0.961 |
| 3 | 1.37× | 69.71% | 69.93% | 0.958 |
| 4 | 1.56× | 61.22% | 60.33% | 0.941 |
| 5 | 1.78× | 53.65% | 53.27% | 0.948 |
| 6 | 2.05× | 46.59% | 46.8% | 0.959 |
| 7 | 2.37× | 40.3% | 40.73% | 0.965 |
| 8 | 2.77× | 34.48% | 34.93% | 0.968 |
| 9 | 3.24× | 29.48% | 29.8% | 0.966 |
| 10 | 3.85× | 24.81% | 25% | 0.963 |
| 11 | 4.62× | 20.67% | 20.73% | 0.958 |
| 12 | 5.61× | 17.02% | 17% | 0.954 |
| 13 | 6.91× | 13.82% | 14.53% | 1.004 |
| 14 | 8.64× | 11.05% | 11.8% | 1.02 |
| 15 | 10.99× | 8.69% | 9% | 0.989 |
| 16 | 14.29× | 6.68% | 6.07% | 0.867 |
| 17 | 18.96× | 5.04% | 4.93% | 0.935 |
| 18 | 26.07× | 3.66% | 3.2% | 0.834 |
| 19 | 37.24× | 2.56% | 2% | 0.745 |
| 20 | 53.82× | 1.77% | 1.33% | 0.718 |
| 21 | 82.36× | 1.16% | 0.8% | 0.659 |
| 22 | 137.59× | 0.69% | 0.47% | 0.642 |
| 23 | 265.35× | 0.36% | 0.13% | 0.354 |
| 24 | 638.82× | 0.15% | 0.13% | 0.852 |
| 25 | 2,457× | 0.04% | 0% | 0 |
| Reached step | Return multiplier | Proportion under the RTP model | Proportion reaching this point | Gross return relative to the stake |
|---|---|---|---|---|
| 1 | 1.18× | 80.93% | 83.4% | 0.984 |
| 2 | 1.46× | 65.41% | 66.07% | 0.965 |
| 3 | 1.83× | 52.19% | 53.8% | 0.985 |
| 4 | 2.31× | 41.34% | 42.33% | 0.978 |
| 5 | 2.95× | 32.37% | 33% | 0.974 |
| 6 | 3.82× | 25% | 24.67% | 0.942 |
| 7 | 5.02× | 19.02% | 19.27% | 0.967 |
| 8 | 6.66× | 14.34% | 14.47% | 0.963 |
| 9 | 9.04× | 10.56% | 10.73% | 0.97 |
| 10 | 12.52× | 7.63% | 7.67% | 0.96 |
| 11 | 17.74× | 5.38% | 5.13% | 0.911 |
| 12 | 25.8× | 3.7% | 3.8% | 0.98 |
| 13 | 38.71× | 2.47% | 2.33% | 0.903 |
| 14 | 60.21× | 1.59% | 1.47% | 0.883 |
| 15 | 97.34× | 0.98% | 0.87% | 0.844 |
| 16 | 166.87× | 0.57% | 0.67% | 1.112 |
| 17 | 305.94× | 0.31% | 0.33% | 1.02 |
| 18 | 595.86× | 0.16% | 0.27% | 1.589 |
| 19 | 1,283.03× | 0.07% | 0.13% | 1.711 |
| 20 | 3,267.64× | 0.03% | 0.07% | 2.178 |
| 21 | 10,898.54× | 0.01% | 0% | 0 |
| 22 | 62,162.09× | 0% | 0% | 0 |
| Reached step | Return multiplier | Proportion under the RTP model | Proportion reaching this point | Gross return relative to the stake |
|---|---|---|---|---|
| 1 | 1.44× | 66.32% | 65.6% | 0.945 |
| 2 | 2.21× | 43.21% | 42% | 0.928 |
| 3 | 3.45× | 27.68% | 27.27% | 0.941 |
| 4 | 5.53× | 17.27% | 16.87% | 0.933 |
| 5 | 9.09× | 10.51% | 10.2% | 0.927 |
| 6 | 15.3× | 6.24% | 6% | 0.918 |
| 7 | 26.78× | 3.57% | 3.27% | 0.875 |
| 8 | 48.7× | 1.96% | 1.47% | 0.714 |
| 9 | 92.54× | 1.03% | 0.87% | 0.802 |
| 10 | 185.08× | 0.52% | 0.4% | 0.74 |
| 11 | 391.25× | 0.24% | 0.33% | 1.304 |
| 12 | 894.28× | 0.11% | 0.07% | 0.596 |
| 13 | 2,235.72× | 0.04% | 0.07% | 1.49 |
| 14 | 6,096.15× | 0.02% | 0% | 0 |
| 15 | 18,960.33× | 0.01% | 0% | 0 |
| 16 | 72,432.75× | 0% | 0% | 0 |
| 17 | 379,632.82× | 0% | 0% | 0 |
| 18 | 3,608,855.25× | 0% | 0% | 0 |
Gross return includes the stake. Payout limits apply. This is no profit estimate.
Past demo rounds only. No prediction of later results.
Outcome generator: independently unverified by us.
Check algorithm, commitments, seeds and nonce. The animation cannot verify these.
The sequel has 30/25/22/18 steps across its four roads, accepts 0.12–200 USD stakes and caps a game win at 20,000 USD. Its coefficients differ from the first title, so compare the exact version you open.
InOut states 95.5%, with a 4.5% long-run house edge. Neither the final multiplier nor a short run of demo rounds verifies that published long-run return. Use that lower return when weighing the sequel against the original’s higher 98%.
No. Thirty listed positions describe the ladder, while random outcomes decide how far a particular round goes. A first-step loss is still possible, and the road length cannot predict the duration of your next attempt.
Multiply stake and reached coefficient to understand the gross amount before the ceiling, then read how the game's 20,000 USD maximum win applies. A large coefficient cannot be quoted as an unlimited payment.
No. Demo credits have no cash value or withdrawal route. They help you understand the stake, step and collect controls; the real-money account and cashier belong to the casino operating that service.
No. It is a rule for your own choices, while the next move remains uncertain. It cannot reveal a future result, verify published RTP or make chasing earlier lost stakes a dependable plan.
Chicken Road 2

Long-run return figure: 98% · Maximum game payment: 10,000 USD
Behind the demo observations
Fixed starting group. Pointwise Wilson intervals shown.
Demo rounds represented: 6,000
Share reaching each successful step
| Game | Road setting | Demo rounds represented | Step one survival | Uncertainty interval for this proportion | Completed roads | Highest multiplier in this run |
|---|---|---|---|---|---|---|
| Chicken Road 2 · Easy road | Easy road | 1,500 | 97.13% | 96.16%–97.86% | 55 | 23.24× |
| Chicken Road 2 · Medium road | Medium road | 1,500 | 89.8% | 88.17%–91.23% | 0 | 638.82× |
| Chicken Road 2 · Hard road | Hard road | 1,500 | 83.4% | 81.43%–85.2% | 0 | 3,267.64× |
| Chicken Road 2 · Daredevil road | Daredevil road | 1,500 | 65.6% | 63.16%–67.96% | 0 | 2,235.72× |
Highest successful position, including later losses. This is no paid prize.
| Reached step | Successful rounds | Demo rounds represented | Proportion reaching this point | Uncertainty interval for this proportion |
|---|---|---|---|---|
| 1 | 1,457 | 1,500 | 97.13% | 96.16%–97.86% |
| 2 | 1,414 | 1,500 | 94.27% | 92.97%–95.33% |
| 3 | 1,369 | 1,500 | 91.27% | 89.73%–92.59% |
| 4 | 1,322 | 1,500 | 88.13% | 86.4%–89.67% |
| 5 | 1,273 | 1,500 | 84.87% | 82.96%–86.59% |
| 6 | 1,219 | 1,500 | 81.27% | 79.21%–83.16% |
| 7 | 1,163 | 1,500 | 77.53% | 75.35%–79.57% |
| 8 | 1,124 | 1,500 | 74.93% | 72.68%–77.06% |
| 9 | 1,067 | 1,500 | 71.13% | 68.79%–73.37% |
| 10 | 1,017 | 1,500 | 67.8% | 65.39%–70.12% |
| 11 | 965 | 1,500 | 64.33% | 61.88%–66.72% |
| 12 | 917 | 1,500 | 61.13% | 58.64%–63.57% |
| 13 | 877 | 1,500 | 58.47% | 55.95%–60.94% |
| 14 | 811 | 1,500 | 54.07% | 51.54%–56.57% |
| 15 | 765 | 1,500 | 51% | 48.47%–53.52% |
| 16 | 718 | 1,500 | 47.87% | 45.35%–50.4% |
| 17 | 671 | 1,500 | 44.73% | 42.23%–47.26% |
| 18 | 626 | 1,500 | 41.73% | 39.26%–44.25% |
| 19 | 579 | 1,500 | 38.6% | 36.17%–41.09% |
| 20 | 535 | 1,500 | 35.67% | 33.28%–38.12% |
| 21 | 491 | 1,500 | 32.73% | 30.41%–35.15% |
| 22 | 442 | 1,500 | 29.47% | 27.21%–31.82% |
| 23 | 395 | 1,500 | 26.33% | 24.17%–28.62% |
| 24 | 345 | 1,500 | 23% | 20.94%–25.2% |
| 25 | 291 | 1,500 | 19.4% | 17.48%–21.48% |
| 26 | 237 | 1,500 | 15.8% | 14.04%–17.73% |
| 27 | 195 | 1,500 | 13% | 11.39%–14.8% |
| 28 | 141 | 1,500 | 9.4% | 8.03%–10.98% |
| 29 | 100 | 1,500 | 6.67% | 5.51%–8.04% |
| 30 | 55 | 1,500 | 3.67% | 2.83%–4.74% |
| Reached step | Successful rounds | Demo rounds represented | Proportion reaching this point | Uncertainty interval for this proportion |
|---|---|---|---|---|
| 1 | 1,347 | 1,500 | 89.8% | 88.17%–91.23% |
| 2 | 1,191 | 1,500 | 79.4% | 77.28%–81.37% |
| 3 | 1,049 | 1,500 | 69.93% | 67.56%–72.2% |
| 4 | 905 | 1,500 | 60.33% | 57.83%–62.78% |
| 5 | 799 | 1,500 | 53.27% | 50.74%–55.78% |
| 6 | 702 | 1,500 | 46.8% | 44.29%–49.33% |
| 7 | 611 | 1,500 | 40.73% | 38.27%–43.24% |
| 8 | 524 | 1,500 | 34.93% | 32.56%–37.38% |
| 9 | 447 | 1,500 | 29.8% | 27.54%–32.16% |
| 10 | 375 | 1,500 | 25% | 22.87%–27.25% |
| 11 | 311 | 1,500 | 20.73% | 18.76%–22.86% |
| 12 | 255 | 1,500 | 17% | 15.18%–18.98% |
| 13 | 218 | 1,500 | 14.53% | 12.84%–16.41% |
| 14 | 177 | 1,500 | 11.8% | 10.26%–13.53% |
| 15 | 135 | 1,500 | 9% | 7.65%–10.55% |
| 16 | 91 | 1,500 | 6.07% | 4.97%–7.39% |
| 17 | 74 | 1,500 | 4.93% | 3.95%–6.15% |
| 18 | 48 | 1,500 | 3.2% | 2.42%–4.22% |
| 19 | 30 | 1,500 | 2% | 1.4%–2.84% |
| 20 | 20 | 1,500 | 1.33% | 0.86%–2.05% |
| 21 | 12 | 1,500 | 0.8% | 0.46%–1.39% |
| 22 | 7 | 1,500 | 0.47% | 0.23%–0.96% |
| 23 | 2 | 1,500 | 0.13% | 0.04%–0.48% |
| 24 | 2 | 1,500 | 0.13% | 0.04%–0.48% |
| 25 | 0 | 1,500 | 0% | 0%–0.26% |
| Reached step | Successful rounds | Demo rounds represented | Proportion reaching this point | Uncertainty interval for this proportion |
|---|---|---|---|---|
| 1 | 1,251 | 1,500 | 83.4% | 81.43%–85.2% |
| 2 | 991 | 1,500 | 66.07% | 63.63%–68.42% |
| 3 | 807 | 1,500 | 53.8% | 51.27%–56.31% |
| 4 | 635 | 1,500 | 42.33% | 39.86%–44.85% |
| 5 | 495 | 1,500 | 33% | 30.67%–35.42% |
| 6 | 370 | 1,500 | 24.67% | 22.55%–26.91% |
| 7 | 289 | 1,500 | 19.27% | 17.35%–21.34% |
| 8 | 217 | 1,500 | 14.47% | 12.78%–16.34% |
| 9 | 161 | 1,500 | 10.73% | 9.27%–12.4% |
| 10 | 115 | 1,500 | 7.67% | 6.43%–9.12% |
| 11 | 77 | 1,500 | 5.13% | 4.13%–6.37% |
| 12 | 57 | 1,500 | 3.8% | 2.94%–4.89% |
| 13 | 35 | 1,500 | 2.33% | 1.68%–3.23% |
| 14 | 22 | 1,500 | 1.47% | 0.97%–2.21% |
| 15 | 13 | 1,500 | 0.87% | 0.51%–1.48% |
| 16 | 10 | 1,500 | 0.67% | 0.36%–1.22% |
| 17 | 5 | 1,500 | 0.33% | 0.14%–0.78% |
| 18 | 4 | 1,500 | 0.27% | 0.1%–0.68% |
| 19 | 2 | 1,500 | 0.13% | 0.04%–0.48% |
| 20 | 1 | 1,500 | 0.07% | 0.01%–0.38% |
| 21 | 0 | 1,500 | 0% | 0%–0.26% |
| 22 | 0 | 1,500 | 0% | 0%–0.26% |
| Reached step | Successful rounds | Demo rounds represented | Proportion reaching this point | Uncertainty interval for this proportion |
|---|---|---|---|---|
| 1 | 984 | 1,500 | 65.6% | 63.16%–67.96% |
| 2 | 630 | 1,500 | 42% | 39.53%–44.52% |
| 3 | 409 | 1,500 | 27.27% | 25.07%–29.58% |
| 4 | 253 | 1,500 | 16.87% | 15.06%–18.85% |
| 5 | 153 | 1,500 | 10.2% | 8.77%–11.83% |
| 6 | 90 | 1,500 | 6% | 4.91%–7.32% |
| 7 | 49 | 1,500 | 3.27% | 2.48%–4.29% |
| 8 | 22 | 1,500 | 1.47% | 0.97%–2.21% |
| 9 | 13 | 1,500 | 0.87% | 0.51%–1.48% |
| 10 | 6 | 1,500 | 0.4% | 0.18%–0.87% |
| 11 | 5 | 1,500 | 0.33% | 0.14%–0.78% |
| 12 | 1 | 1,500 | 0.07% | 0.01%–0.38% |
| 13 | 1 | 1,500 | 0.07% | 0.01%–0.38% |
| 14 | 0 | 1,500 | 0% | 0%–0.26% |
| 15 | 0 | 1,500 | 0% | 0%–0.26% |
| 16 | 0 | 1,500 | 0% | 0%–0.26% |
| 17 | 0 | 1,500 | 0% | 0%–0.26% |
| 18 | 0 | 1,500 | 0% | 0%–0.26% |
Demo rows only. No forecasts or independent RNG audit.
Model: RTP divided by the multiplier. We have not independently verified it.
| Reached step | Proportion reaching this point | Uncertainty interval for this proportion | Proportion under the RTP model |
|---|---|---|---|
| 1 | 97.13% | 96.16% – 97.86% | 94.55% |
| 2 | 94.27% | 92.97% – 95.33% | 92.72% |
| 3 | 91.27% | 89.73% – 92.59% | 90.09% |
| 4 | 88.13% | 86.4% – 89.67% | 86.82% |
| 5 | 84.87% | 82.96% – 86.59% | 83.04% |
| 6 | 81.27% | 79.21% – 83.16% | 80.25% |
| 7 | 77.53% | 75.35% – 79.57% | 77.02% |
| 8 | 74.93% | 72.68% – 77.06% | 73.46% |
| 9 | 71.13% | 68.79% – 73.37% | 70.74% |
| 10 | 67.8% | 65.39% – 70.12% | 67.25% |
| 11 | 64.33% | 61.88% – 66.72% | 64.53% |
| 12 | 61.13% | 58.64% – 63.57% | 61.22% |
| 13 | 58.47% | 55.95% – 60.94% | 57.88% |
| 14 | 54.07% | 51.54% – 56.57% | 54.57% |
| 15 | 51% | 48.47% – 53.52% | 51.62% |
| 16 | 47.87% | 45.35% – 50.4% | 48.23% |
| 17 | 44.73% | 42.23% – 47.26% | 45.05% |
| 18 | 41.73% | 39.26% – 44.25% | 41.89% |
| 19 | 38.6% | 36.17% – 41.09% | 38.66% |
| 20 | 35.67% | 33.28% – 38.12% | 35.37% |
| 21 | 32.73% | 30.41% – 35.15% | 32.26% |
| 22 | 29.47% | 27.21% – 31.82% | 29.12% |
| 23 | 26.33% | 24.17% – 28.62% | 25.81% |
| 24 | 23% | 20.94% – 25.2% | 23.24% |
| 25 | 19.4% | 17.48% – 21.48% | 20.58% |
| 26 | 15.8% | 14.04% – 17.73% | 17.72% |
| 27 | 13% | 11.39% – 14.8% | 14.69% |
| 28 | 9.4% | 8.03% – 10.98% | 11.42% |
| 29 | 6.67% | 5.51% – 8.04% | 7.91% |
| 30 | 3.67% | 2.83% – 4.74% | 4.11% |
| Reached step | Proportion reaching this point | Uncertainty interval for this proportion | Proportion under the RTP model |
|---|---|---|---|
| 1 | 89.8% | 88.17% – 91.23% | 88.43% |
| 2 | 79.4% | 77.28% – 81.37% | 78.93% |
| 3 | 69.93% | 67.56% – 72.2% | 69.71% |
| 4 | 60.33% | 57.83% – 62.78% | 61.22% |
| 5 | 53.27% | 50.74% – 55.78% | 53.65% |
| 6 | 46.8% | 44.29% – 49.33% | 46.59% |
| 7 | 40.73% | 38.27% – 43.24% | 40.3% |
| 8 | 34.93% | 32.56% – 37.38% | 34.48% |
| 9 | 29.8% | 27.54% – 32.16% | 29.48% |
| 10 | 25% | 22.87% – 27.25% | 24.81% |
| 11 | 20.73% | 18.76% – 22.86% | 20.67% |
| 12 | 17% | 15.18% – 18.98% | 17.02% |
| 13 | 14.53% | 12.84% – 16.41% | 13.82% |
| 14 | 11.8% | 10.26% – 13.53% | 11.05% |
| 15 | 9% | 7.65% – 10.55% | 8.69% |
| 16 | 6.07% | 4.97% – 7.39% | 6.68% |
| 17 | 4.93% | 3.95% – 6.15% | 5.04% |
| 18 | 3.2% | 2.42% – 4.22% | 3.66% |
| 19 | 2% | 1.4% – 2.84% | 2.56% |
| 20 | 1.33% | 0.86% – 2.05% | 1.77% |
| 21 | 0.8% | 0.46% – 1.39% | 1.16% |
| 22 | 0.47% | 0.23% – 0.96% | 0.69% |
| 23 | 0.13% | 0.04% – 0.48% | 0.36% |
| 24 | 0.13% | 0.04% – 0.48% | 0.15% |
| 25 | 0% | 0% – 0.26% | 0.04% |
| Reached step | Proportion reaching this point | Uncertainty interval for this proportion | Proportion under the RTP model |
|---|---|---|---|
| 1 | 83.4% | 81.43% – 85.2% | 80.93% |
| 2 | 66.07% | 63.63% – 68.42% | 65.41% |
| 3 | 53.8% | 51.27% – 56.31% | 52.19% |
| 4 | 42.33% | 39.86% – 44.85% | 41.34% |
| 5 | 33% | 30.67% – 35.42% | 32.37% |
| 6 | 24.67% | 22.55% – 26.91% | 25% |
| 7 | 19.27% | 17.35% – 21.34% | 19.02% |
| 8 | 14.47% | 12.78% – 16.34% | 14.34% |
| 9 | 10.73% | 9.27% – 12.4% | 10.56% |
| 10 | 7.67% | 6.43% – 9.12% | 7.63% |
| 11 | 5.13% | 4.13% – 6.37% | 5.38% |
| 12 | 3.8% | 2.94% – 4.89% | 3.7% |
| 13 | 2.33% | 1.68% – 3.23% | 2.47% |
| 14 | 1.47% | 0.97% – 2.21% | 1.59% |
| 15 | 0.87% | 0.51% – 1.48% | 0.98% |
| 16 | 0.67% | 0.36% – 1.22% | 0.57% |
| 17 | 0.33% | 0.14% – 0.78% | 0.31% |
| 18 | 0.27% | 0.1% – 0.68% | 0.16% |
| 19 | 0.13% | 0.04% – 0.48% | 0.07% |
| 20 | 0.07% | 0.01% – 0.38% | 0.03% |
| 21 | 0% | 0% – 0.26% | 0.01% |
| 22 | 0% | 0% – 0.26% | 0% |
| Reached step | Proportion reaching this point | Uncertainty interval for this proportion | Proportion under the RTP model |
|---|---|---|---|
| 1 | 65.6% | 63.16% – 67.96% | 66.32% |
| 2 | 42% | 39.53% – 44.52% | 43.21% |
| 3 | 27.27% | 25.07% – 29.58% | 27.68% |
| 4 | 16.87% | 15.06% – 18.85% | 17.27% |
| 5 | 10.2% | 8.77% – 11.83% | 10.51% |
| 6 | 6% | 4.91% – 7.32% | 6.24% |
| 7 | 3.27% | 2.48% – 4.29% | 3.57% |
| 8 | 1.47% | 0.97% – 2.21% | 1.96% |
| 9 | 0.87% | 0.51% – 1.48% | 1.03% |
| 10 | 0.4% | 0.18% – 0.87% | 0.52% |
| 11 | 0.33% | 0.14% – 0.78% | 0.24% |
| 12 | 0.07% | 0.01% – 0.38% | 0.11% |
| 13 | 0.07% | 0.01% – 0.38% | 0.04% |
| 14 | 0% | 0% – 0.26% | 0.02% |
| 15 | 0% | 0% – 0.26% | 0.01% |
| 16 | 0% | 0% – 0.26% | 0% |
| 17 | 0% | 0% – 0.26% | 0% |
| 18 | 0% | 0% – 0.26% | 0% |
| Reached step | Return multiplier |
|---|---|
| 1 | 1.01× |
| 2 | 1.03× |
| 3 | 1.06× |
| 4 | 1.1× |
| 5 | 1.15× |
| 6 | 1.19× |
| 7 | 1.24× |
| 8 | 1.3× |
| 9 | 1.35× |
| 10 | 1.42× |
| 11 | 1.48× |
| 12 | 1.56× |
| 13 | 1.65× |
| 14 | 1.75× |
| 15 | 1.85× |
| 16 | 1.98× |
| 17 | 2.12× |
| 18 | 2.28× |
| 19 | 2.47× |
| 20 | 2.7× |
| 21 | 2.96× |
| 22 | 3.28× |
| 23 | 3.7× |
| 24 | 4.11× |
| 25 | 4.64× |
| 26 | 5.39× |
| 27 | 6.5× |
| 28 | 8.36× |
| 29 | 12.08× |
| 30 | 23.24× |
| Reached step | Return multiplier |
|---|---|
| 1 | 1.08× |
| 2 | 1.21× |
| 3 | 1.37× |
| 4 | 1.56× |
| 5 | 1.78× |
| 6 | 2.05× |
| 7 | 2.37× |
| 8 | 2.77× |
| 9 | 3.24× |
| 10 | 3.85× |
| 11 | 4.62× |
| 12 | 5.61× |
| 13 | 6.91× |
| 14 | 8.64× |
| 15 | 10.99× |
| 16 | 14.29× |
| 17 | 18.96× |
| 18 | 26.07× |
| 19 | 37.24× |
| 20 | 53.82× |
| 21 | 82.36× |
| 22 | 137.59× |
| 23 | 265.35× |
| 24 | 638.82× |
| 25 | 2,457× |
| Reached step | Return multiplier |
|---|---|
| 1 | 1.18× |
| 2 | 1.46× |
| 3 | 1.83× |
| 4 | 2.31× |
| 5 | 2.95× |
| 6 | 3.82× |
| 7 | 5.02× |
| 8 | 6.66× |
| 9 | 9.04× |
| 10 | 12.52× |
| 11 | 17.74× |
| 12 | 25.8× |
| 13 | 38.71× |
| 14 | 60.21× |
| 15 | 97.34× |
| 16 | 166.87× |
| 17 | 305.94× |
| 18 | 595.86× |
| 19 | 1,283.03× |
| 20 | 3,267.64× |
| 21 | 10,898.54× |
| 22 | 62,162.09× |
| Reached step | Return multiplier |
|---|---|
| 1 | 1.44× |
| 2 | 2.21× |
| 3 | 3.45× |
| 4 | 5.53× |
| 5 | 9.09× |
| 6 | 15.3× |
| 7 | 26.78× |
| 8 | 48.7× |
| 9 | 92.54× |
| 10 | 185.08× |
| 11 | 391.25× |
| 12 | 894.28× |
| 13 | 2,235.72× |
| 14 | 6,096.15× |
| 15 | 18,960.33× |
| 16 | 72,432.75× |
| 17 | 379,632.82× |
| 18 | 3,608,855.25× |
18+ only. Set affordable limits. Take breaks. Never chase a losing balance.