Chicken Road 2
Long-run return figure: 95.5% · Maximum game payment: 20,000 USD

Bet Chicken Road review 1 / 2 · InOut Games · 2024
Read our Chicken Road review for the original game’s modes, stake range and payout cap. Understand the controls before trying its browser demo. 18+.
Bet Chicken Road research team · Read our recording method

Demo credits have no cash value. Adults 18+.
Long-run return figure: 98% · Maximum game payment: 10,000 USD
Read this version’s full reviewChicken Road is a step-based InOut Games casino title with four roads and a collect decision after a successful move. This Chicken Road review explains the rules, difficulty modes, browser controls and published return of the original game. Advancing risks the round; collecting settles the reached return. Timing a tap against the traffic animation does not give you control over the random result.
The original accepts 0.01–150 USD per round, has a 10,000 USD maximum game win and a published 98% RTP. Those figures describe different parts of the game. The stake range sets what may enter a round, the cap constrains a payment and RTP describes long-run turnover. Reading them together prevents the biggest ladder coefficient from telling the whole story.
This Chicken Road game review covers InOut’s first title. The Chicken Road game is a crossing-based gambling product, with a separate sequel rather than a single set of rules for every version.
The opening Easy values are ×1.03, ×1.07 and ×1.12. The first collect opportunity therefore adds a small amount above the initial stake if the move succeeds. Farther along, the ladder reaches ×2.04, ×3.50, ×9.81 and eventually ×19.44. These are positions on a road, rather than a sequence you can expect every time.
Use the early values to read the gross payment and the profit separately. Multiplying the stake by ×1.03 gives the complete return, including the money already put in. The gain on that round is only the difference above the stake. Choosing another move puts the currently available payment back in the balance of the decision. Easy remains gambling even when the opening coefficient looks modest.
Medium contains 22 steps. It starts at ×1.12, continues through ×1.28 and ×1.47, and ends at ×1,788.80. The late ladder contains increasingly large jumps; it should not be read as a promise that persistence will reach them. Every later collect opportunity depends on surviving the earlier requests to advance.
The practical comparison with Easy begins at the first few positions. At a fixed stake, a successful opening move offers a different amount, and continuing exposes a different reached return. Neither the mode name nor a recent win tells you which next move will work. If you choose to compare the controls in demo, keep the stake constant and watch the current collect amount rather than jumping between final tiles.
Hard uses 20 steps. Its first coefficients are ×1.23, ×1.55 and ×1.98, and the last is ×41,321.43. A shorter listed route is not a shorter certain path to a payment. It is a different set of random betting choices, with much larger coefficients attached to later positions.
The original's 10,000 USD maximum win matters when reading that endpoint. A multiplication that produces more than the cap cannot be presented as an unrestricted payment from the game. Check how the rules apply the ceiling for the version you open. The ladder tells you the coefficient associated with a position; the maximum-win rule tells you where a payment stops. They belong beside each other whenever large values are compared.
The original Daredevil progression opens at ×1.63 across its 15 positions. The next values are ×2.80 and ×4.95; the endpoint is ×2,542,251.93. That final number is striking, but it does not describe a typical round or the likelihood of reaching the end. A failed move can still remove the entire round stake before those distant values become collectable.
Avoid comparing a stake multiplied by that endpoint with a bank balance you expect to receive. The game caps the maximum win at 10,000 USD, and a casino has its own account and withdrawal conditions around the game. Read the actual rules rather than treating a large number on the road as an offer. You can understand this setting without making it the next place to put money.
The permitted 0.01–150 USD range covers individual game rounds. A casino's minimum deposit, account currency and cashier rules are separate. If your balance uses another currency, check the converted amount displayed by the service. The USD range is not a spending recommendation.
Start with money that could be lost without affecting essentials. Then choose whether any part of that amount belongs on a round at all. Increasing the stake after a failed step increases the next currency loss if that round also fails. It does not increase your knowledge of the next outcome. A budget chosen before the game is more stable than a bet amount negotiated with the previous result.
After a successful step, compare the currently available collect amount with the consequence of advancing again. You are choosing between ending that round and exposing it to another result. The multiplier on a later tile is not added to your balance merely because you can see it. It becomes relevant only if the round reaches that position.
A fixed cash-out rule can make your own decisions consistent, but it cannot turn a random game into a source of reliable profit. It also does not make a losing step overdue for replacement by a win. A useful demo exercise is to collect at a reached position, read the settlement and stop. That shows what the control does without pretending the exercise predicts a money session.
InOut publishes 98% RTP for Chicken Road. Subtracting that from 100% gives a 2% house edge for the original. This is a theoretical relationship over extensive play. It is not a promise to return 98% of your personal deposit or to restrict every session's loss to 2%.
Turnover counts stakes placed, including money won and then bet again. That distinction matters when the same initial balance funds many rounds. A session might display several successful cash-outs and still finish below its starting balance because later bets put the money at risk again. Look at the full balance movement as well as individual round payments. The original’s 98% cannot replace the lower 95.5% RTP of Chicken Road 2.
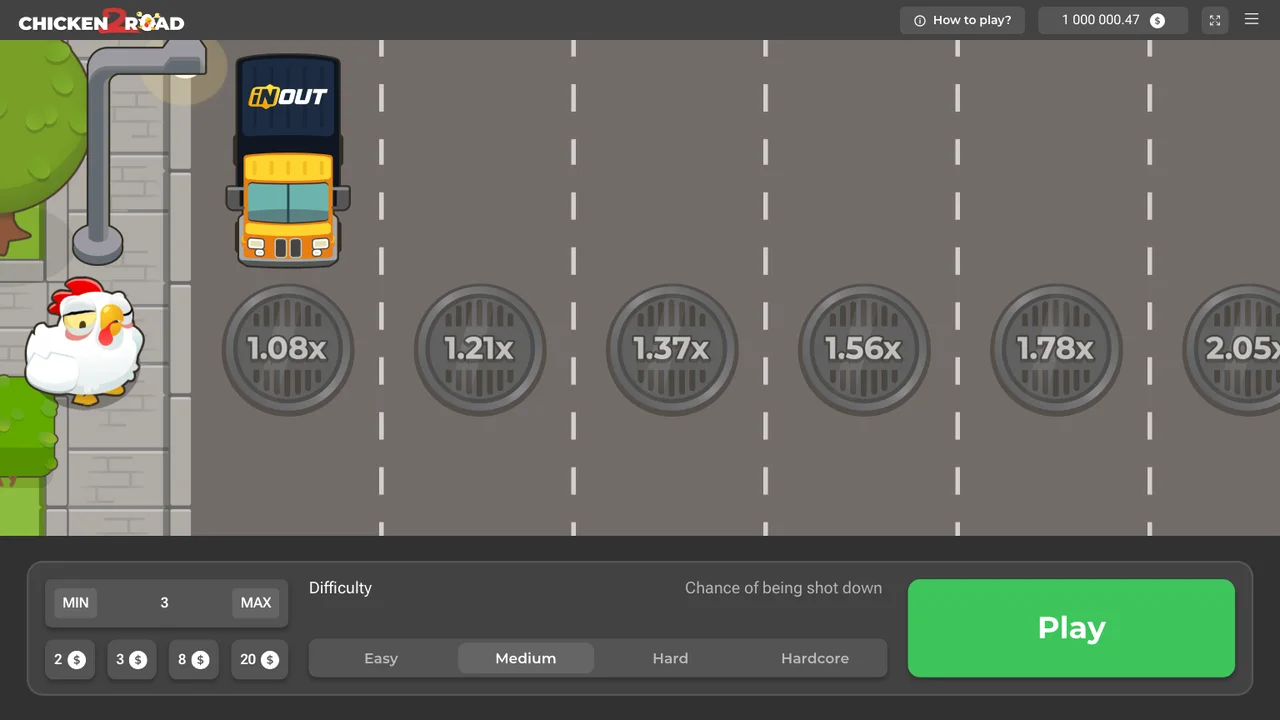
Find the stake entry, difficulty selector, advance control and collect control before starting. Their placement matters when a fast animation pulls attention toward the road. Check the selected amount after switching between the demo and a casino account, or after reopening the game. A familiar background does not ensure the previous settings remained selected.
On a small display, enlarge the playing area only if the amounts remain readable. The useful layout is the one that lets you distinguish the current payment from the next coefficient. If the connection drops or a result is unclear, check the round history through the casino instead of pressing start repeatedly. Account support belongs to the service holding the balance, not to a stranger offering a game repair.
Demo credits have no cash value, so a practice balance is not a withdrawal waiting to happen. Use them to see how a step request changes the screen, how collecting closes the round and where the next stake is selected. Those questions can be answered without attaching real money to the experiment.
Hold the stake steady while comparing roads. Then you can tell that the change in a reached amount comes from the coefficient rather than a simultaneous change in stake. If an unusually large demo return appears, keep it in that context. It shows a possible screen state from that run; it does not demonstrate a personal advantage, a profitable schedule or a result you can repeat on demand.
The original runs in a mobile or desktop browser without a separate download. An Android predictor app, bot or APK cannot turn its animation into advance knowledge of the game’s algorithm. A collect target changes how you play, rather than revealing which step succeeds.
Chicken Road is an InOut Games product. That identity does not certify every casino using its name, every app-store listing or every advert showing a chicken. Read the provider name within the game and identify the operator around it. Check local rules and the operator's licence before deciding whether a money account is appropriate.
Our review does not independently verify the game's random generator or a reproducible provably fair process. A moving animation and a short set of outcomes cannot replace such a check. The statistics blocks describe the totals and labels attached to their own runs. They should not be used to infer that a future round must reach a particular position or repay an earlier failed stake.
The original makes its central trade-off easy to describe: keep a reached return or risk the round again. The four roads let you compare quite different numerical ladders. The published RTP and USD limits give useful context, while the maximum-win cap prevents the largest coefficient from being read as an unlimited payment.
That clarity concerns understanding the game, not finding a way around its house advantage. Before choosing a road, decide whether the stake and the possible loss suit your finances. If a higher setting feels necessary because an earlier round lost, close the game and revisit the budget later. The ability to name a multiplier does not create a reason to put more money behind it.
For adults 18+. Decide your time and money limits before starting the original. Make breaks part of the session and never chase losses with a larger stake.
Long-run return figure: 95.5% · Maximum game payment: 20,000 USD
| Reached step | Return multiplier |
|---|---|
| 1 | 1.03× |
| 2 | 1.07× |
| 3 | 1.12× |
| 4 | 1.17× |
| 5 | 1.23× |
| 6 | 1.29× |
| 7 | 1.36× |
| 8 | 1.44× |
| 9 | 1.53× |
| 10 | 1.63× |
| 11 | 1.75× |
| 12 | 1.88× |
| 13 | 2.04× |
| 14 | 2.22× |
| 15 | 2.45× |
| 16 | 2.72× |
| 17 | 3.06× |
| 18 | 3.5× |
| 19 | 4.08× |
| 20 | 4.9× |
| 21 | 6.13× |
| 22 | 6.61× |
| 23 | 9.81× |
| 24 | 19.44× |
| Reached step | Return multiplier |
|---|---|
| 1 | 1.12× |
| 2 | 1.28× |
| 3 | 1.47× |
| 4 | 1.7× |
| 5 | 1.98× |
| 6 | 2.33× |
| 7 | 2.76× |
| 8 | 3.32× |
| 9 | 4.03× |
| 10 | 4.96× |
| 11 | 6.2× |
| 12 | 6.91× |
| 13 | 8.9× |
| 14 | 11.74× |
| 15 | 15.99× |
| 16 | 22.61× |
| 17 | 33.58× |
| 18 | 53.2× |
| 19 | 92.17× |
| 20 | 182.51× |
| 21 | 451.71× |
| 22 | 1,788.8× |
| Reached step | Return multiplier |
|---|---|
| 1 | 1.23× |
| 2 | 1.55× |
| 3 | 1.98× |
| 4 | 2.56× |
| 5 | 3.36× |
| 6 | 4.49× |
| 7 | 5.49× |
| 8 | 7.53× |
| 9 | 10.56× |
| 10 | 15.21× |
| 11 | 22.59× |
| 12 | 34.79× |
| 13 | 55.97× |
| 14 | 94.99× |
| 15 | 172.42× |
| 16 | 341.4× |
| 17 | 760.46× |
| 18 | 2,007.63× |
| 19 | 6,956.47× |
| 20 | 41,321.43× |
| Reached step | Return multiplier |
|---|---|
| 1 | 1.63× |
| 2 | 2.8× |
| 3 | 4.95× |
| 4 | 9.08× |
| 5 | 15.21× |
| 6 | 30.12× |
| 7 | 62.96× |
| 8 | 140.24× |
| 9 | 337.19× |
| 10 | 890.19× |
| 11 | 2,643.89× |
| 12 | 9,161.08× |
| 13 | 39,301.05× |
| 14 | 233,448.29× |
| 15 | 2,542,251.93× |
| Reached step | Return multiplier | Proportion under the RTP model | Proportion reaching this point | Gross return relative to the stake |
|---|---|---|---|---|
| 1 | 1.03× | 95.15% | 96.33% | 0.992 |
| 2 | 1.07× | 91.59% | 92.53% | 0.99 |
| 3 | 1.12× | 87.5% | 88.4% | 0.99 |
| 4 | 1.17× | 83.76% | 83.93% | 0.982 |
| 5 | 1.23× | 79.67% | 80.13% | 0.986 |
| 6 | 1.29× | 75.97% | 75.67% | 0.976 |
| 7 | 1.36× | 72.06% | 72.13% | 0.981 |
| 8 | 1.44× | 68.06% | 66.93% | 0.964 |
| 9 | 1.53× | 64.05% | 62.2% | 0.952 |
| 10 | 1.63× | 60.12% | 58.47% | 0.953 |
| 11 | 1.75× | 56% | 54.53% | 0.954 |
| 12 | 1.88× | 52.13% | 50.07% | 0.941 |
| 13 | 2.04× | 48.04% | 45.87% | 0.936 |
| 14 | 2.22× | 44.14% | 41.4% | 0.919 |
| 15 | 2.45× | 40% | 37.33% | 0.915 |
| 16 | 2.72× | 36.03% | 33.6% | 0.914 |
| 17 | 3.06× | 32.03% | 29.27% | 0.896 |
| 18 | 3.5× | 28% | 25.6% | 0.896 |
| 19 | 4.08× | 24.02% | 22.27% | 0.908 |
| 20 | 4.9× | 20% | 17.87% | 0.875 |
| 21 | 6.13× | 15.99% | 14.4% | 0.883 |
| 22 | 6.61× | 14.83% | 10.93% | 0.723 |
| 23 | 9.81× | 9.99% | 7.6% | 0.746 |
| 24 | 19.44× | 5.04% | 4.2% | 0.816 |
| Reached step | Return multiplier | Proportion under the RTP model | Proportion reaching this point | Gross return relative to the stake |
|---|---|---|---|---|
| 1 | 1.12× | 87.5% | 88.8% | 0.995 |
| 2 | 1.28× | 76.56% | 77.47% | 0.992 |
| 3 | 1.47× | 66.67% | 67.27% | 0.989 |
| 4 | 1.7× | 57.65% | 58.73% | 0.998 |
| 5 | 1.98× | 49.49% | 49.67% | 0.983 |
| 6 | 2.33× | 42.06% | 42.4% | 0.988 |
| 7 | 2.76× | 35.51% | 35.67% | 0.984 |
| 8 | 3.32× | 29.52% | 29.93% | 0.994 |
| 9 | 4.03× | 24.32% | 24.47% | 0.986 |
| 10 | 4.96× | 19.76% | 19.27% | 0.956 |
| 11 | 6.2× | 15.81% | 15.27% | 0.947 |
| 12 | 6.91× | 14.18% | 11.53% | 0.797 |
| 13 | 8.9× | 11.01% | 9.07% | 0.807 |
| 14 | 11.74× | 8.35% | 7% | 0.822 |
| 15 | 15.99× | 6.13% | 5.4% | 0.863 |
| 16 | 22.61× | 4.33% | 4.33% | 0.98 |
| 17 | 33.58× | 2.92% | 3% | 1.007 |
| 18 | 53.2× | 1.84% | 1.6% | 0.851 |
| 19 | 92.17× | 1.06% | 1% | 0.922 |
| 20 | 182.51× | 0.54% | 0.4% | 0.73 |
| 21 | 451.71× | 0.22% | 0.2% | 0.903 |
| 22 | 1,788.8× | 0.05% | 0% | 0 |
| Reached step | Return multiplier | Proportion under the RTP model | Proportion reaching this point | Gross return relative to the stake |
|---|---|---|---|---|
| 1 | 1.23× | 79.67% | 79.13% | 0.973 |
| 2 | 1.55× | 63.23% | 63.27% | 0.981 |
| 3 | 1.98× | 49.49% | 49.47% | 0.979 |
| 4 | 2.56× | 38.28% | 37% | 0.947 |
| 5 | 3.36× | 29.17% | 29.07% | 0.977 |
| 6 | 4.49× | 21.83% | 22.8% | 1.024 |
| 7 | 5.49× | 17.85% | 15.73% | 0.864 |
| 8 | 7.53× | 13.01% | 11.47% | 0.863 |
| 9 | 10.56× | 9.28% | 7.93% | 0.838 |
| 10 | 15.21× | 6.44% | 5.6% | 0.852 |
| 11 | 22.59× | 4.34% | 3.6% | 0.813 |
| 12 | 34.79× | 2.82% | 2.6% | 0.905 |
| 13 | 55.97× | 1.75% | 1.47% | 0.821 |
| 14 | 94.99× | 1.03% | 0.73% | 0.697 |
| 15 | 172.42× | 0.57% | 0.47% | 0.805 |
| 16 | 341.4× | 0.29% | 0.07% | 0.228 |
| 17 | 760.46× | 0.13% | 0% | 0 |
| 18 | 2,007.63× | 0.05% | 0% | 0 |
| 19 | 6,956.47× | 0.01% | 0% | 0 |
| 20 | 41,321.43× | 0% | 0% | 0 |
| Reached step | Return multiplier | Proportion under the RTP model | Proportion reaching this point | Gross return relative to the stake |
|---|---|---|---|---|
| 1 | 1.63× | 60.12% | 60% | 0.978 |
| 2 | 2.8× | 35% | 36.33% | 1.017 |
| 3 | 4.95× | 19.8% | 20.8% | 1.03 |
| 4 | 9.08× | 10.79% | 10.87% | 0.987 |
| 5 | 15.21× | 6.44% | 6.07% | 0.923 |
| 6 | 30.12× | 3.25% | 2.87% | 0.863 |
| 7 | 62.96× | 1.56% | 1.53% | 0.965 |
| 8 | 140.24× | 0.7% | 0.8% | 1.122 |
| 9 | 337.19× | 0.29% | 0.07% | 0.225 |
| 10 | 890.19× | 0.11% | 0% | 0 |
| 11 | 2,643.89× | 0.04% | 0% | 0 |
| 12 | 9,161.08× | 0.01% | 0% | 0 |
| 13 | 39,301.05× | 0% | 0% | 0 |
| 14 | 233,448.29× | 0% | 0% | 0 |
| 15 | 2,542,251.93× | 0% | 0% | 0 |
Gross return includes the stake. Payout limits apply. This is no profit estimate.
Past demo rounds only. No prediction of later results.
Behind the demo observations
Fixed starting group. Pointwise Wilson intervals shown.
Demo rounds represented: 6,000
Share reaching each successful step
| Game | Road setting | Demo rounds represented | Step one survival | Uncertainty interval for this proportion | Completed roads | Highest multiplier in this run |
|---|---|---|---|---|---|---|
| Chicken Road · Easy road | Easy road | 1,500 | 96.33% | 95.26%–97.17% | 63 | 19.44× |
| Chicken Road · Medium road | Medium road | 1,500 | 88.8% | 87.1%–90.3% | 0 | 451.71× |
| Chicken Road · Hard road | Hard road | 1,500 | 79.13% | 77%–81.11% | 0 | 341.4× |
| Chicken Road · Daredevil road | Daredevil road | 1,500 | 60% | 57.5%–62.45% | 0 | 337.19× |
Highest successful position, including later losses. This is no paid prize.
| Reached step | Successful rounds | Demo rounds represented | Proportion reaching this point | Uncertainty interval for this proportion |
|---|---|---|---|---|
| 1 | 1,445 | 1,500 | 96.33% | 95.26%–97.17% |
| 2 | 1,388 | 1,500 | 92.53% | 91.09%–93.76% |
| 3 | 1,326 | 1,500 | 88.4% | 86.68%–89.92% |
| 4 | 1,259 | 1,500 | 83.93% | 81.99%–85.7% |
| 5 | 1,202 | 1,500 | 80.13% | 78.04%–82.07% |
| 6 | 1,135 | 1,500 | 75.67% | 73.43%–77.77% |
| 7 | 1,082 | 1,500 | 72.13% | 69.81%–74.34% |
| 8 | 1,004 | 1,500 | 66.93% | 64.51%–69.27% |
| 9 | 933 | 1,500 | 62.2% | 59.72%–64.62% |
| 10 | 877 | 1,500 | 58.47% | 55.95%–60.94% |
| 11 | 818 | 1,500 | 54.53% | 52.01%–57.04% |
| 12 | 751 | 1,500 | 50.07% | 47.54%–52.59% |
| 13 | 688 | 1,500 | 45.87% | 43.36%–48.4% |
| 14 | 621 | 1,500 | 41.4% | 38.93%–43.91% |
| 15 | 560 | 1,500 | 37.33% | 34.92%–39.81% |
| 16 | 504 | 1,500 | 33.6% | 31.25%–36.03% |
| 17 | 439 | 1,500 | 29.27% | 27.02%–31.62% |
| 18 | 384 | 1,500 | 25.6% | 23.46%–27.87% |
| 19 | 334 | 1,500 | 22.27% | 20.23%–24.44% |
| 20 | 268 | 1,500 | 17.87% | 16.01%–19.89% |
| 21 | 216 | 1,500 | 14.4% | 12.71%–16.27% |
| 22 | 164 | 1,500 | 10.93% | 9.45%–12.61% |
| 23 | 114 | 1,500 | 7.6% | 6.36%–9.05% |
| 24 | 63 | 1,500 | 4.2% | 3.3%–5.34% |
| Reached step | Successful rounds | Demo rounds represented | Proportion reaching this point | Uncertainty interval for this proportion |
|---|---|---|---|---|
| 1 | 1,332 | 1,500 | 88.8% | 87.1%–90.3% |
| 2 | 1,162 | 1,500 | 77.47% | 75.28%–79.51% |
| 3 | 1,009 | 1,500 | 67.27% | 64.85%–69.59% |
| 4 | 881 | 1,500 | 58.73% | 56.22%–61.2% |
| 5 | 745 | 1,500 | 49.67% | 47.14%–52.19% |
| 6 | 636 | 1,500 | 42.4% | 39.92%–44.92% |
| 7 | 535 | 1,500 | 35.67% | 33.28%–38.12% |
| 8 | 449 | 1,500 | 29.93% | 27.67%–32.3% |
| 9 | 367 | 1,500 | 24.47% | 22.36%–26.71% |
| 10 | 289 | 1,500 | 19.27% | 17.35%–21.34% |
| 11 | 229 | 1,500 | 15.27% | 13.54%–17.18% |
| 12 | 173 | 1,500 | 11.53% | 10.01%–13.25% |
| 13 | 136 | 1,500 | 9.07% | 7.72%–10.63% |
| 14 | 105 | 1,500 | 7% | 5.82%–8.4% |
| 15 | 81 | 1,500 | 5.4% | 4.37%–6.66% |
| 16 | 65 | 1,500 | 4.33% | 3.41%–5.49% |
| 17 | 45 | 1,500 | 3% | 2.25%–3.99% |
| 18 | 24 | 1,500 | 1.6% | 1.08%–2.37% |
| 19 | 15 | 1,500 | 1% | 0.61%–1.64% |
| 20 | 6 | 1,500 | 0.4% | 0.18%–0.87% |
| 21 | 3 | 1,500 | 0.2% | 0.07%–0.59% |
| 22 | 0 | 1,500 | 0% | 0%–0.26% |
| Reached step | Successful rounds | Demo rounds represented | Proportion reaching this point | Uncertainty interval for this proportion |
|---|---|---|---|---|
| 1 | 1,187 | 1,500 | 79.13% | 77%–81.11% |
| 2 | 949 | 1,500 | 63.27% | 60.8%–65.67% |
| 3 | 742 | 1,500 | 49.47% | 46.94%–51.99% |
| 4 | 555 | 1,500 | 37% | 34.59%–39.47% |
| 5 | 436 | 1,500 | 29.07% | 26.82%–31.42% |
| 6 | 342 | 1,500 | 22.8% | 20.75%–24.99% |
| 7 | 236 | 1,500 | 15.73% | 13.98%–17.66% |
| 8 | 172 | 1,500 | 11.47% | 9.95%–13.18% |
| 9 | 119 | 1,500 | 7.93% | 6.67%–9.41% |
| 10 | 84 | 1,500 | 5.6% | 4.55%–6.88% |
| 11 | 54 | 1,500 | 3.6% | 2.77%–4.67% |
| 12 | 39 | 1,500 | 2.6% | 1.91%–3.53% |
| 13 | 22 | 1,500 | 1.47% | 0.97%–2.21% |
| 14 | 11 | 1,500 | 0.73% | 0.41%–1.31% |
| 15 | 7 | 1,500 | 0.47% | 0.23%–0.96% |
| 16 | 1 | 1,500 | 0.07% | 0.01%–0.38% |
| 17 | 0 | 1,500 | 0% | 0%–0.26% |
| 18 | 0 | 1,500 | 0% | 0%–0.26% |
| 19 | 0 | 1,500 | 0% | 0%–0.26% |
| 20 | 0 | 1,500 | 0% | 0%–0.26% |
| Reached step | Successful rounds | Demo rounds represented | Proportion reaching this point | Uncertainty interval for this proportion |
|---|---|---|---|---|
| 1 | 900 | 1,500 | 60% | 57.5%–62.45% |
| 2 | 545 | 1,500 | 36.33% | 33.94%–38.8% |
| 3 | 312 | 1,500 | 20.8% | 18.82%–22.93% |
| 4 | 163 | 1,500 | 10.87% | 9.39%–12.54% |
| 5 | 91 | 1,500 | 6.07% | 4.97%–7.39% |
| 6 | 43 | 1,500 | 2.87% | 2.14%–3.84% |
| 7 | 23 | 1,500 | 1.53% | 1.02%–2.29% |
| 8 | 12 | 1,500 | 0.8% | 0.46%–1.39% |
| 9 | 1 | 1,500 | 0.07% | 0.01%–0.38% |
| 10 | 0 | 1,500 | 0% | 0%–0.26% |
| 11 | 0 | 1,500 | 0% | 0%–0.26% |
| 12 | 0 | 1,500 | 0% | 0%–0.26% |
| 13 | 0 | 1,500 | 0% | 0%–0.26% |
| 14 | 0 | 1,500 | 0% | 0%–0.26% |
| 15 | 0 | 1,500 | 0% | 0%–0.26% |
Demo rows only. No forecasts or independent RNG audit.
The provider range is 0.01–150 USD for one round. That range does not describe a casino's deposit minimum or an amount suitable for your finances. Check the account currency and cashier terms separately.
No. It concerns long-run turnover in the original game, with a 2% house edge. Your own session can end far above or below that relationship, and a losing balance is not owed a recovery.
No. Easy names a 24-step ladder whose opening coefficient is ×1.03. A step still has a random outcome; a small opening increase does not make that move certain or protect the stake.
The coefficient describes a ladder position, while the cap limits the resulting payment. The original has a 10,000 USD maximum win. Multiplying stake and coefficient without applying that ceiling can overstate a possible return.
Collect settles the game round. Moving money out of the casino account uses the cashier and its conditions. The collect button does not replace verification checks or determine an operator's withdrawal processing time.
No. The sequel has different roads and money limits, and InOut states its RTP as 95.5%, implying a 4.5% theoretical house edge over the long run. A shared provider and similar name do not justify copying the original's percentage into a sequel comparison.
18+ only. Set affordable limits. Take breaks. Never chase a losing balance.
Model: RTP divided by the multiplier. We have not independently verified it.
| Reached step | Proportion reaching this point | Uncertainty interval for this proportion | Proportion under the RTP model |
|---|---|---|---|
| 1 | 96.33% | 95.26% – 97.17% | 95.15% |
| 2 | 92.53% | 91.09% – 93.76% | 91.59% |
| 3 | 88.4% | 86.68% – 89.92% | 87.5% |
| 4 | 83.93% | 81.99% – 85.7% | 83.76% |
| 5 | 80.13% | 78.04% – 82.07% | 79.67% |
| 6 | 75.67% | 73.43% – 77.77% | 75.97% |
| 7 | 72.13% | 69.81% – 74.34% | 72.06% |
| 8 | 66.93% | 64.51% – 69.27% | 68.06% |
| 9 | 62.2% | 59.72% – 64.62% | 64.05% |
| 10 | 58.47% | 55.95% – 60.94% | 60.12% |
| 11 | 54.53% | 52.01% – 57.04% | 56% |
| 12 | 50.07% | 47.54% – 52.59% | 52.13% |
| 13 | 45.87% | 43.36% – 48.4% | 48.04% |
| 14 | 41.4% | 38.93% – 43.91% | 44.14% |
| 15 | 37.33% | 34.92% – 39.81% | 40% |
| 16 | 33.6% | 31.25% – 36.03% | 36.03% |
| 17 | 29.27% | 27.02% – 31.62% | 32.03% |
| 18 | 25.6% | 23.46% – 27.87% | 28% |
| 19 | 22.27% | 20.23% – 24.44% | 24.02% |
| 20 | 17.87% | 16.01% – 19.89% | 20% |
| 21 | 14.4% | 12.71% – 16.27% | 15.99% |
| 22 | 10.93% | 9.45% – 12.61% | 14.83% |
| 23 | 7.6% | 6.36% – 9.05% | 9.99% |
| 24 | 4.2% | 3.3% – 5.34% | 5.04% |
| Reached step | Proportion reaching this point | Uncertainty interval for this proportion | Proportion under the RTP model |
|---|---|---|---|
| 1 | 88.8% | 87.1% – 90.3% | 87.5% |
| 2 | 77.47% | 75.28% – 79.51% | 76.56% |
| 3 | 67.27% | 64.85% – 69.59% | 66.67% |
| 4 | 58.73% | 56.22% – 61.2% | 57.65% |
| 5 | 49.67% | 47.14% – 52.19% | 49.49% |
| 6 | 42.4% | 39.92% – 44.92% | 42.06% |
| 7 | 35.67% | 33.28% – 38.12% | 35.51% |
| 8 | 29.93% | 27.67% – 32.3% | 29.52% |
| 9 | 24.47% | 22.36% – 26.71% | 24.32% |
| 10 | 19.27% | 17.35% – 21.34% | 19.76% |
| 11 | 15.27% | 13.54% – 17.18% | 15.81% |
| 12 | 11.53% | 10.01% – 13.25% | 14.18% |
| 13 | 9.07% | 7.72% – 10.63% | 11.01% |
| 14 | 7% | 5.82% – 8.4% | 8.35% |
| 15 | 5.4% | 4.37% – 6.66% | 6.13% |
| 16 | 4.33% | 3.41% – 5.49% | 4.33% |
| 17 | 3% | 2.25% – 3.99% | 2.92% |
| 18 | 1.6% | 1.08% – 2.37% | 1.84% |
| 19 | 1% | 0.61% – 1.64% | 1.06% |
| 20 | 0.4% | 0.18% – 0.87% | 0.54% |
| 21 | 0.2% | 0.07% – 0.59% | 0.22% |
| 22 | 0% | 0% – 0.26% | 0.05% |
| Reached step | Proportion reaching this point | Uncertainty interval for this proportion | Proportion under the RTP model |
|---|---|---|---|
| 1 | 79.13% | 77% – 81.11% | 79.67% |
| 2 | 63.27% | 60.8% – 65.67% | 63.23% |
| 3 | 49.47% | 46.94% – 51.99% | 49.49% |
| 4 | 37% | 34.59% – 39.47% | 38.28% |
| 5 | 29.07% | 26.82% – 31.42% | 29.17% |
| 6 | 22.8% | 20.75% – 24.99% | 21.83% |
| 7 | 15.73% | 13.98% – 17.66% | 17.85% |
| 8 | 11.47% | 9.95% – 13.18% | 13.01% |
| 9 | 7.93% | 6.67% – 9.41% | 9.28% |
| 10 | 5.6% | 4.55% – 6.88% | 6.44% |
| 11 | 3.6% | 2.77% – 4.67% | 4.34% |
| 12 | 2.6% | 1.91% – 3.53% | 2.82% |
| 13 | 1.47% | 0.97% – 2.21% | 1.75% |
| 14 | 0.73% | 0.41% – 1.31% | 1.03% |
| 15 | 0.47% | 0.23% – 0.96% | 0.57% |
| 16 | 0.07% | 0.01% – 0.38% | 0.29% |
| 17 | 0% | 0% – 0.26% | 0.13% |
| 18 | 0% | 0% – 0.26% | 0.05% |
| 19 | 0% | 0% – 0.26% | 0.01% |
| 20 | 0% | 0% – 0.26% | 0% |
| Reached step | Proportion reaching this point | Uncertainty interval for this proportion | Proportion under the RTP model |
|---|---|---|---|
| 1 | 60% | 57.5% – 62.45% | 60.12% |
| 2 | 36.33% | 33.94% – 38.8% | 35% |
| 3 | 20.8% | 18.82% – 22.93% | 19.8% |
| 4 | 10.87% | 9.39% – 12.54% | 10.79% |
| 5 | 6.07% | 4.97% – 7.39% | 6.44% |
| 6 | 2.87% | 2.14% – 3.84% | 3.25% |
| 7 | 1.53% | 1.02% – 2.29% | 1.56% |
| 8 | 0.8% | 0.46% – 1.39% | 0.7% |
| 9 | 0.07% | 0.01% – 0.38% | 0.29% |
| 10 | 0% | 0% – 0.26% | 0.11% |
| 11 | 0% | 0% – 0.26% | 0.04% |
| 12 | 0% | 0% – 0.26% | 0.01% |
| 13 | 0% | 0% – 0.26% | 0% |
| 14 | 0% | 0% – 0.26% | 0% |
| 15 | 0% | 0% – 0.26% | 0% |
Outcome generator: independently unverified by us.
Check algorithm, commitments, seeds and nonce. The animation cannot verify these.
Chicken Road